I know, I know. There is no news I'm my blog in over two weeks now. Well nobody reads it anyway, but I feel like starting my blog to post my achievements so maybe one day someone will read about them.
At this moment I have a fair amount of projects I want to start. Unfortunately I don't have the time, energy or money to do all of them, on top of doing full time research, and taking care of my plants. Here is a list of the projects I want to start, Anyone of this projects is enough to keep me away from any other in the list so I will have to make some decisions:
1) Learn Cocoa and Objective C.
Well, since apple have been stealing my soul since the very moment I buy my mac mini I want to develop applications with graphical interface for my personal use, and make them available if anyone else have any use for them.
2) Find a place to Live.
This is kind of obvious why I need to do this.
3) Implement a console window via usb.
I have an extra monitor, check.
I have a computer that doesn't handle dual displays, check.
I use the terminal in my mac a lot, check.
Can I connect my second monitor to my mac and have a full screen terminal on it via usb, nope.
Do I know any device on the market that will do this for me, not that I know of.
Can I do it myself, maybe.
4) Visual GSL.
For my own research I have been using the GSL (GNU Scientific Library) and it is really a nice library for what I do. But I would like to make a graphical implementation of it so I can test if the method will work the way I want it to work. And then it have to generate the code for me the code for me.
For example I have to calculate some Greens functions making a Hilbert transform from the non-interacting electronic density. In doing so I have to allow for an imaginary part on the self-energy. And I find myself coding things like:
gsl_complex var = gsl_complex_add_real(gsl_complex_add(sigma1,sigma2),mu);
witch only means var = sigma1+sigma2+mu; where var, sigma1 and sigma2 are complex numbers. It would be nice to do a little program where I can input sigma1+sigma2+mu, and I can copy paste the generated code to my program.
5) Poker odds.
I have been watching poker on television for a while, and played some games (no real money involved) online, and it's fun. So I would like to code a program that will tell me what are the best hands to start with. And I know AA is the best hand you can start with, but I what about for example, J-10 suited vs Q-K off suite.
6) Learn openGL.
This will help me to make plots for my programs in number 4 with in the same program with only adding a button, plot.
7) Infinite desks.
I can't talk about this.
8) Learn to use Xmgrace.
My advisor suggested I have to discard gnuplot and use xmgrace instead.
9) Write on my own blog.
As you can see I have a lot of things I want to embrace and the day only have 24 hours. I will try to keep posting things here on a regular basis.
-Chuy
Saturday, May 26, 2007
Monday, May 7, 2007
Tutorial: Make Latex ready plots using gnuplot.
Gnuplot is a free yet easy to use command line plotter for the Linux OS. You can also install it on Mac OS X and Windows. If you are using Mac OS X and want the OS X feel in your plots you can type
>set terminal aqua
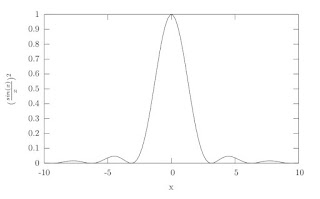
With gnuplot you can either plot data files or functions, in this case we will plot (sin(x)/x)^2, first we want to plot it and make sure we get the right plot.
1) open gnuplot and type
>plot (sin(x)/x)**2
2) Make a new file i.e. plot.txt and open it in any text editor, add the lines
set terminal epslatex
set output "myplot.eps"
This two lines will tell gnuplot that the output file has to be an encapsulated postscript (eps) with name myplot.eps, now you can add to the file the plot you want to make.
set key off
set xlabel '$x$'
set ylabel '$(\frac{sin(x)}{x})^{2}$'
plot (sin(x)/x)**2
First set the options of your plot, xlabel, ylabel, etc, and then input the plot command. Note that you can input data in the latex commands and latex will translate that to actual formatted text equations. Now you can save the file.
3) In the terminal type the command
>gnuplot plot.txt
You will notice two new files in your directory. myplot.eps and myplot.tex
4) If you already have a tex document you insert your new plot on it. First make sure you have the following two lines in the headers of your tex file;
\usepackage{graphicx}
\usepackage{epstopdf}
gnuplot warns you about adding the first one but not the second one in the help pages.
now just place your graphic with the command, \input{myplot}
5) Or you could also compile myplot.tex file directly only a few modifications are needed, first open myplot.tex and add the following lines
\documentclass[14pt]{article}
\usepackage{graphicx}
\usepackage{epstopdf}
\begin{document}
skip the rest of the text and locate the last line
\endinput
and delete it. Finally add the line
\end{document}
And that is it, now you just need to compile your tex document to make it a pdf. Sometimes pdflatex have problems making the plot when both files have the same name myplot.tex & myplot.eps, in such a case, change the name of the eps file. i.e. othername.eps and change the line in myplot.tex
\includegraphics{myplot}
to
\includegraphics{./othername.eps}
Cheers.
>set terminal aqua
With gnuplot you can either plot data files or functions, in this case we will plot (sin(x)/x)^2, first we want to plot it and make sure we get the right plot.
1) open gnuplot and type
>plot (sin(x)/x)**2
2) Make a new file i.e. plot.txt and open it in any text editor, add the lines
set terminal epslatex
set output "myplot.eps"
This two lines will tell gnuplot that the output file has to be an encapsulated postscript (eps) with name myplot.eps, now you can add to the file the plot you want to make.
set key off
set xlabel '$x$'
set ylabel '$(\frac{sin(x)}{x})^{2}$'
plot (sin(x)/x)**2
First set the options of your plot, xlabel, ylabel, etc, and then input the plot command. Note that you can input data in the latex commands and latex will translate that to actual formatted text equations. Now you can save the file.
3) In the terminal type the command
>gnuplot plot.txt
You will notice two new files in your directory. myplot.eps and myplot.tex
4) If you already have a tex document you insert your new plot on it. First make sure you have the following two lines in the headers of your tex file;
\usepackage{graphicx}
\usepackage{epstopdf}
gnuplot warns you about adding the first one but not the second one in the help pages.
now just place your graphic with the command, \input{myplot}
5) Or you could also compile myplot.tex file directly only a few modifications are needed, first open myplot.tex and add the following lines
\documentclass[14pt]{article}
\usepackage{graphicx}
\usepackage{epstopdf}
\begin{document}
skip the rest of the text and locate the last line
\endinput
and delete it. Finally add the line
\end{document}
And that is it, now you just need to compile your tex document to make it a pdf. Sometimes pdflatex have problems making the plot when both files have the same name myplot.tex & myplot.eps, in such a case, change the name of the eps file. i.e. othername.eps and change the line in myplot.tex
\includegraphics{myplot}
to
\includegraphics{./othername.eps}

Cheers.
Subscribe to:
Posts (Atom)
